Verifying firewall configuration and API availability with custom monitoring
The Challenge
Obtain an accurate report on what endpoints and IP addresses our site was making outbound requests to.
Most sites need to talk to at least one other site, domain or service. So when your site is hosted behind tight firewall and network controls, how do you ensure that it can consistently reach out to all the IPs and endpoints it requires? How do you verify that firewall or network changes haven’t broken something unintentionally? Network, Security and System Administrators often don’t have access to log in to the site and “click around”, let alone the knowledge required to test each and every endpoint.
We have several sites that run behind a WAF with a tight allowlist for outbound traffic. Even with a custom internal service in place for gathering and proxying (and sniffing!) web requests outbound from the site, we continued to find functionality that needed to talk to more web addresses which the proxy service wasn’t ready for.
To verify that all our external services could be reached, we needed a tool that could track and test every single one.
Our Solution
We worked with our clients’ IT teams to develop a tool for testing network connectivity and delivering a clear report. Recently rebuilt for modern Drupal, our custom report provides validation that all the APIs and domains a site needs to communicate with are accessible.
After some (manual) discovery and documentation, you’re able to configure a plugin for each API, IP and domain that the system needs to reach out to. A standard system report page then checks each one, showing an appropriate status.
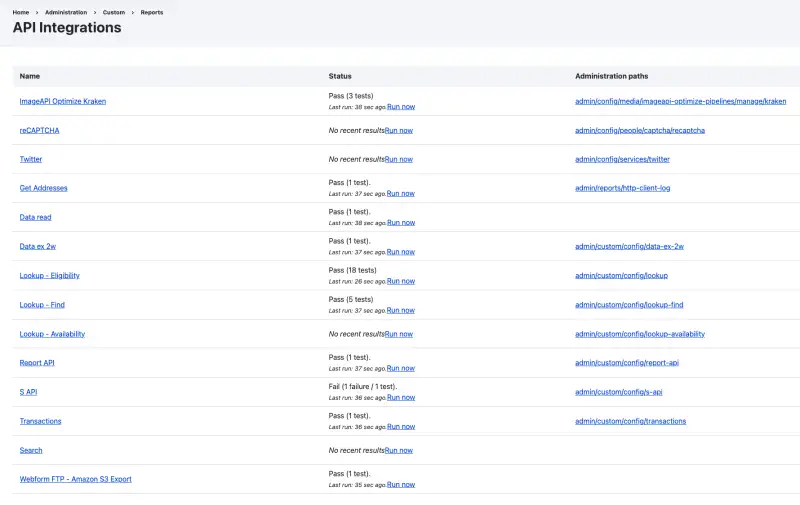
Documented list of network requirements
Now when administrators ask us what endpoints a site needs to talk to, we can provide a report. It’s a helpful resource to screenshot / copy & paste / print for others that need the information. Plus, the report will always be up to date with any connection that is supposed to work, because connections simply won't work if they're not allow-listed.
Automated tracking
Every new endpoint interaction gets recorded for the report, with zero manual effort. We used HTTP Client Log module https://www.drupal.org/project/http_client_log to automatically log the outbound requests, and, further testament to our community involvement, we contributed such extensions and improvements as to become co-maintainers of the module.
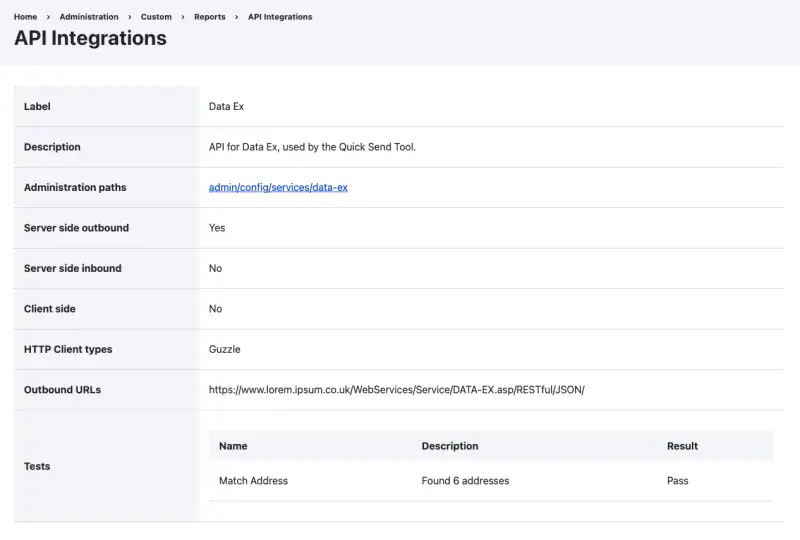
Contact details for product owners
If something were to break on Production, it would be helpful to know who is the key contact or owner for the associated functionality. Some simple fields for contact name, role and email address provide quick access to that crucial information, which may not be common knowledge nor readily available across a larger organisation.
Verify network and firewall changes
With this custom tooling, it’s possible to verify that network changes - planned or otherwise - haven’t affected the site. That’s been hugely valuable to our system and network administrators.
Validate Drupal builds, upgrades and migrations
Huge changes like Drupal 7 → 10 upgrades usually break something - but our connectivity report has supported several D10 upgrades through confirming that the new site is ready and connected before putting it live. There’s huge benefit in being able to demonstrate that each environment (most notably production and preproduction) is fully up and working before allowing traffic through.
Benefiting the community
Supporting Drupal's open source http_client_log module
As Drupal Certified Partners, we love to make regular contribution to the Drupal community in various forms and our DCP status signifies and rewards this effort.
The http_client_log module was an existing module available at Drupal.org, to which we contributed a number of fixes and then key additional functionality.
Whilst we did build our own private tooling for this project, there was notable benefit for the community too. In fact, our input to the module was sizeable enough to warrant us becoming co-maintainers. Sites that use http_client_log benefit from improved stability and functionality, and can access its reports on network usage.
Future Development
Given the time and opportunity, we’re keen to develop our toolkit further with things like:
Tracking of network activity
Identifying when endpoints are no longer used would be a valuable iteration for managing an allowlist. With the key functionality already in place, a little extra data and reporting would help identify and report on allowlist entries that can be removed.
Regular test runs, with failure notifications
Presently you have to visit the report page to run it and see the result, but it may well be valuable to have the report run automatically on a regular basis, with automatic emails / slack messages / webhooks to notify of failures. (or at least a warning message for any logged-in admins, if such network requests are not permitted!)
Gain access
This tooling is presently under private development for us and our clients, but we'd be glad to discuss options for bringing our tooling and expertise to your site.